Hey guys, SamacharDesi Editorial Team here, your trusted source for cutting-edge market insights and strategic financial guidance. As we navigate the dynamic markets of 2026, understanding sophisticated tools is more crucial than ever for securing your financial future. Today, we’re diving deep into one of the most powerful and often misunderstood indicators utilized by the financial elite: the VWAP Trading Strategy. If you’ve ever wondered how Professional Day Traders consistently find optimal entry and exit points, this comprehensive guide will unlock the secrets behind the Volume Weighted Average Price and equip you with systematic market guidelines for your personal finance decisions.
- What is VWAP and Why is it Indispensable for Professional Day Traders?
- The Core VWAP Calculation: Simplicity in Power
- Core VWAP Trading Strategies for 2026 Markets
- Key Parameters and Considerations for VWAP in 2026
- Risk Disclosures and Management for VWAP Trading
- VWAP vs. Other Key Indicators: A 2026 Perspective
- Real-World Application & Personal Finance Decisions in 2026
- Conclusion: Empowering Your Trading Journey in 2026 with VWAP
- Frequently Asked Questions (FAQ)
What is VWAP and Why is it Indispensable for Professional Day Traders?
The Volume Weighted Average Price (VWAP) is not just another technical indicator; it’s a benchmark, a guide, and a critical component in the arsenal of Professional Day Traders, institutional investors, and even algorithmic trading desks. Unlike simple moving averages that only consider price, VWAP factors in both price and volume, giving a much more accurate representation of the true average price a security has traded at throughout the day, weighted by the volume at each price level.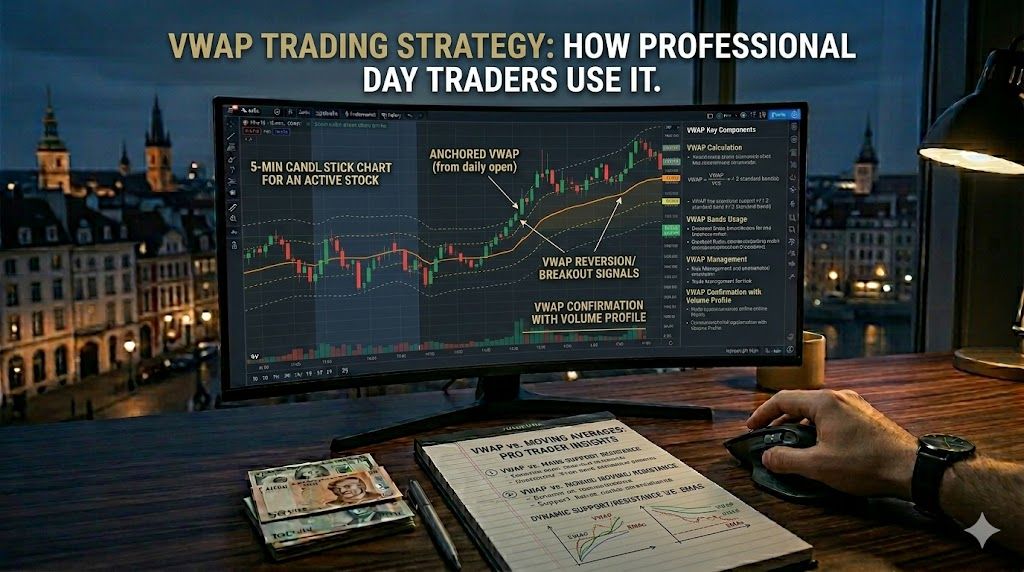
In 2026, with markets moving faster than ever and data analytics becoming increasingly sophisticated, VWAP remains a cornerstone for several reasons:
- It helps traders determine whether they are getting a good price relative to the day’s average, volume-adjusted price.
- It acts as a key support or resistance level, particularly in highly liquid assets.
- Institutional players use VWAP targets to execute large orders with minimal market impact, aiming to buy below VWAP and sell above VWAP.
- For Day Trading, VWAP offers invaluable context, allowing for precise entry and exit points.
The Core VWAP Calculation: Simplicity in Power
While modern trading platforms automatically display VWAP, understanding its underlying calculation solidifies its utility. The formula essentially sums the typical price (high + low + close / 3) multiplied by the volume for each transaction or period, and then divides that sum by the total volume for the trading period. This yields the average price weighted by volume.
VWAP Formula Breakdown:
Sum of (Typical Price * Volume) for each period
-----------------------------------------------
       Total Volume for the trading period
Where Typical Price = (High + Low + Close) / 3
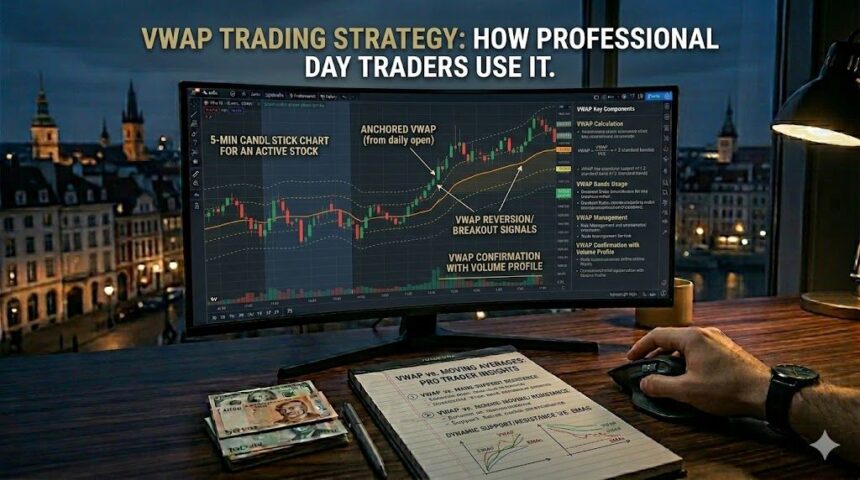
In practice, day traders observe VWAP as a continuous line on their intraday charts. The line resets at the beginning of each trading day, making it a purely intraday indicator, distinct from longer-term moving averages.
How Professional Day Traders Leverage VWAP
The strategic applications of VWAP are diverse and powerful. Here’s how the pros deploy this indicator:
- Identifying Optimal Entry and Exit Points: Traders often look to buy when the price is below VWAP, considering it a “discounted” price, and sell when it’s above VWAP, viewing it as a “premium.”
- Trend Confirmation: If a stock consistently trades above VWAP, it confirms an uptrend. Conversely, persistent trading below VWAP signals a downtrend. A strong trend often sees price “hugging” the VWAP line.
- Benchmark for Execution: Large institutional orders aim to execute their trades “at or better than VWAP.” This means if they are buying, they want their average execution price to be at or below VWAP. If selling, at or above VWAP. This strategy minimizes market impact and demonstrates efficient trade execution.
- Stop Loss Placement: VWAP can serve as a dynamic reference point for setting stop loss orders. If a long position breaches VWAP to the downside, it might indicate a shift in intraday momentum, prompting an exit.
- Identifying Market Turning Points: Significant deviations from VWAP, especially on high volume, can precede reversals. A stock that has been far above VWAP for an extended period might be overextended and due for a pullback towards the mean.
Core VWAP Trading Strategies for 2026 Markets
Understanding the ‘what’ and ‘why’ is just the beginning. Let’s delve into actionable strategies that professional day traders employ.
VWAP Bounce Strategy
This strategy is popular in trending markets. Traders look for price to approach VWAP, “bounce” off it (either from below or above), and continue in the prevailing trend direction.
Steps:
- Identify a clear intraday trend (e.g., strong bullish momentum).
- Wait for the price to pull back towards the VWAP line.
- Look for candlestick patterns or order flow indications of rejection at VWAP (e.g., bullish engulfing candle on VWAP for a long entry, high buying volume).
- Enter a long position if bouncing off VWAP upwards; short if bouncing downwards.
- Set stop loss slightly below (for long) or above (for short) the VWAP line, considering recent low/high.
VWAP Crossover Strategy
Similar to moving average crossovers, this strategy focuses on price crossing the VWAP line, signaling a potential shift in intraday momentum or trend.
Steps:
- Observe the price action relative to VWAP.
- When the price crosses above VWAP, especially with increasing volume, it can signal a potential long entry.
- When the price crosses below VWAP, particularly with increased selling volume, it might indicate a short entry.
- Confirm with other indicators or price action (e.g., break of a resistance level after crossing above VWAP).
VWAP as a Mean Reversion Indicator
While often used for trend following, VWAP also provides context for mean reversion. If a stock deviates significantly from VWAP, it often tends to revert to it, especially if the deviation occurs on diminishing volume.
Steps:
- Identify stocks showing extreme deviations from VWAP (e.g., 2 standard deviations away, if using VWAP bands).
- Look for signs of exhaustion in the current move (e.g., decreasing volume, bearish/bullish divergence on oscillators).
- Enter a counter-trend trade, anticipating a move back towards VWAP. This is a higher-risk strategy and requires strong confirmation.
Key Parameters and Considerations for VWAP in 2026
- Timeframes: VWAP is exclusively an intraday trading tool. It’s most effective on 1-minute, 5-minute, or 15-minute charts. Avoid using it for swing or long-term positions.
- Volatility Adjustment: In 2026, high-frequency trading and geopolitical events can amplify volatility. VWAP provides a robust anchor during volatile sessions, but traders must adjust their position sizing and stop loss parameters accordingly.
- Combining with Other Indicators: VWAP is powerful, but even stronger when combined with other forms of technical analysis. Consider pairing it with:
- Moving Averages (SMA/EMA): For longer-term intraday trend confirmation.
- RSI or Stochastic Oscillators: To identify overbought/oversold conditions in conjunction with price position relative to VWAP.
- Order Flow and Market Profile: To understand institutional activity around VWAP levels.
- Automated Trading Systems & VWAP: Many algorithmic trading strategies in 2026 incorporate VWAP for execution and entry/exit logic. Understanding how these algorithms interact with VWAP can give retail traders an edge.
Risk Disclosures and Management for VWAP Trading
Even with the most sophisticated strategies, day trading inherently carries significant risk. The VWAP Trading Strategy is a tool, not a guarantee of profit. Responsible trading demands robust risk management.
- Capital Preservation: Never risk more than a small percentage (e.g., 1-2%) of your trading capital on any single trade.
- Position Sizing: Adjust your position size based on your stop loss and risk tolerance. Smaller positions for volatile stocks or higher-risk setups.
- Emotional Discipline: Adhere strictly to your trading plan. Avoid revenge trading, chasing prices, or prematurely moving stop losses.
- Market Volatility: VWAP can become less reliable during extreme news-driven volatility or low-volume periods. Understand when to step back.
- Backtesting: Always backtest any strategy thoroughly before deploying it with real capital, especially considering the evolving market conditions of 2026.
VWAP vs. Other Key Indicators: A 2026 Perspective
To highlight VWAP’s unique strengths, let’s compare it to other commonly used indicators.
| Feature | VWAP | Simple Moving Average (SMA) | Exponential Moving Average (EMA) |
|---|---|---|---|
| Calculation Basis | Price & Volume (Volume-weighted) | Average Price over a period | Weighted Average Price (recent prices more weight) |
| Timeframe Focus | Exclusively Intraday Trading (resets daily) | Any (intraday to long-term) | Any (intraday to long-term) |
| Key Use Cases | Entry and Exit Points, institutional benchmarking, trend confirmation (intraday) | Trend identification, support/resistance, crossovers | Faster trend identification, smoother reaction to price |
| Institutional Relevance | High (critical for large order execution and compliance) | Moderate (general trend analysis) | Moderate (general trend analysis) |
| Responsiveness | Dynamic, reflects true average price considering volume | Lagging, smoother | Less lagging than SMA, more responsive to recent price changes |
Real-World Application & Personal Finance Decisions in 2026
For the individual investor or aspiring day trader in 2026, incorporating VWAP into your personal finance decisions means adopting a more professional and data-driven approach to intraday market participation. While you may not be executing multi-million dollar institutional orders, understanding how those orders are placed relative to VWAP provides crucial context for your own trading. You can adapt these market guidelines by:
- Using VWAP to identify fair value: Are you buying a stock at a premium or discount compared to the average intraday price?
- Confirming intraday trends: Don’t fight the trend. Use VWAP to confirm if a stock is truly strong (above VWAP) or weak (below VWAP).
- Refining your entry and exit points: Instead of arbitrary entries, wait for price to interact meaningfully with VWAP for higher-probability setups.
- Practicing with a simulator: Before risking real capital, hone your VWAP strategies in a simulated trading environment.
Conclusion: Empowering Your Trading Journey in 2026 with VWAP
The VWAP Trading Strategy is far more than a simple line on a chart; it’s a sophisticated benchmark, a powerful trend indicator, and a cornerstone of professional day traders’ methodologies in 2026. By understanding its calculation, strategic applications, and integrating it with robust risk disclosures, you can elevate your day trading game. The SamacharDesi Editorial Team encourages you to apply these market guidelines diligently, practice disciplined execution, and consistently refine your approach. The journey to becoming a consistently profitable trader is continuous, and VWAP is an invaluable compass. Start incorporating VWAP into your analysis today and take a significant step towards mastering the intraday markets!
Frequently Asked Questions (FAQ)
What is the main difference between VWAP and a simple moving average?
The main difference is that VWAP incorporates volume into its calculation, giving more weight to price levels where more shares were traded. A simple moving average (SMA) only considers price and gives equal weight to all prices within its calculation period, regardless of volume. VWAP also resets daily, focusing solely on intraday activity, whereas SMAs can be applied to any timeframe.
Is VWAP only useful for day trading?
Yes, VWAP is primarily an intraday trading indicator. It resets at the beginning of each trading day, meaning its value is only relevant for the current day’s trading session. For swing trading or long-term investing, other indicators like longer-period moving averages (e.g., 50-day, 200-day SMA/EMA) are more appropriate.
Can retail traders effectively use VWAP like institutions?
Absolutely! While retail traders typically don’t execute large orders that impact the market, understanding how institutions use VWAP for execution provides valuable context. Retail traders can leverage VWAP for identifying optimal entry and exit points, confirming intraday trends, and setting dynamic stop loss levels, much like the pros.
Are there any drawbacks to using VWAP?
Like any indicator, VWAP is not foolproof. It can be less effective in extremely choppy or range-bound markets where there isn’t a clear intraday trend. Also, relying solely on VWAP without considering other factors like overall market sentiment, news, or complementary indicators can lead to suboptimal decisions. It’s best used as part of a comprehensive trading plan.
Should I use VWAP bands (standard deviations) for trading?
Many professional platforms offer VWAP bands, which are standard deviation lines plotted above and below the VWAP line. These bands can help identify overextended moves and potential mean-reversion opportunities. Price moving outside these bands might suggest a strong trend or an overbought/oversold condition that could lead to a pullback towards VWAP. They add another layer of analysis to the core VWAP strategy.
Written by SamacharDesi Editorial Team
Official editorial intelligence team. We monitor, cross-verify, and publish high-utility reviews, guides, job alerts, and scheme parameters under strict factual verification guidelines.