Hey guys, SamacharDesi Editorial Team here, bringing you an exclusive, data-driven deep dive into one of the most fundamental yet powerful concepts in financial trading: Support and Resistance Levels. In the dynamic markets of 2026, where algorithmic trading and global events create constant volatility, mastering these invisible market forces is not just an advantage—it’s a necessity for achieving precise trade entries and robust personal finance decisions.
- The Unseen Pillars of Market Precision: Understanding Support and Resistance in 2026
- What are Support and Resistance Levels?
- Why Mastering Support and Resistance is Critical for Your 2026 Portfolio
- Identifying and Validating Key Levels: Your Blueprint for Accuracy
- The Art of Drawing S&R Levels: Beyond the Basics
- Advanced Validation Techniques for Reliable S&R Zones
- Strategies for Precise Trade Entries Using S&R in 2026
- The Bounce Play: Entry at Support or Resistance Retest
- The Breakout Strategy: Capitalizing on S&R Breaches
- Integrating Volume and Price Action for Higher Probability Trades
- Risk Management and Position Sizing: Protecting Your Capital
- Setting Stop-Loss Orders Below Support and Above Resistance
- Realistic Target Setting and Profit Taking
- Common Pitfalls and How to Avoid Them in 2026 Trading
- Conclusion
Forget the hype; let’s focus on verifiable strategies. Our goal today is to equip you with systematic market guidelines, verified steps, and critical risk disclosures so you can confidently identify and leverage these crucial price zones. Prepare to transform your trading approach from speculative guessing to calculated precision.
The Unseen Pillars of Market Precision: Understanding Support and Resistance in 2026
What are Support and Resistance Levels?
At their core, Support and Resistance levels are specific price points or zones on a chart where the price action historically tends to pause, reverse, or consolidate. They represent critical psychological barriers in the market where buying or selling pressure is expected to dominate.
- Support Level: A price point where a downtrend is expected to pause due to a concentration of demand. Buyers tend to step in, preventing the price from falling further. Think of it as a “floor” for the price.
- Resistance Level: A price point where an uptrend is expected to pause due to a concentration of supply. Sellers tend to step in, preventing the price from rising higher. Think of it as a “ceiling” for the price.
These levels are not arbitrary lines; they are reflections of collective market psychology, memory, and the interplay between supply and demand.
Why Mastering Support and Resistance is Critical for Your 2026 Portfolio
In 2026, with enhanced data analytics and faster information flow, understanding the behavior around these levels is paramount for several reasons:
- Enhanced Precision: S&R levels offer specific price zones for potential entries and exits, minimizing guesswork.
- Risk Management: They provide natural locations for placing stop-loss orders, defining your maximum risk per trade.
- Identifying Market Reversals: Strong S&R zones often act as turning points, indicating potential trend reversals or continuations.
- Strategic Advantage: By anticipating market reactions at these levels, you gain an edge over traders who ignore them.
- Validation for Other Indicators: S&R levels can confirm signals from other technical indicators, increasing the probability of a successful trade.
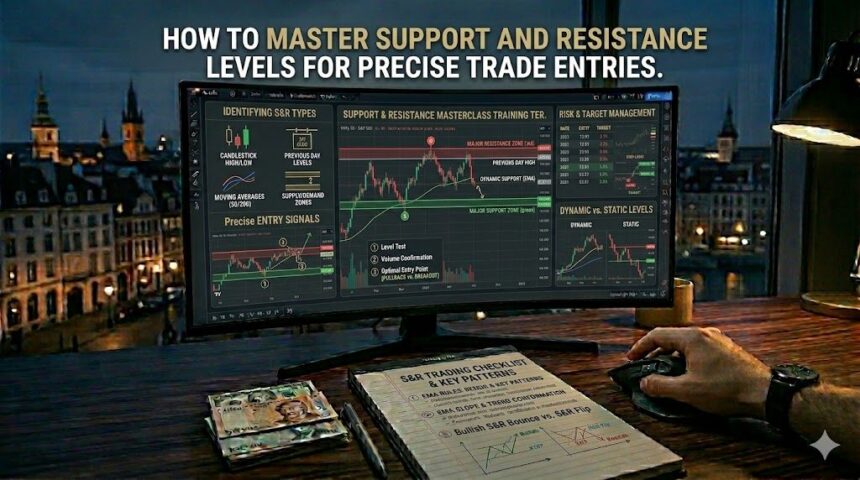
Identifying and Validating Key Levels: Your Blueprint for Accuracy
The Art of Drawing S&R Levels: Beyond the Basics
Drawing effective Support and Resistance levels isn’t just about connecting a few dots. It requires a systematic approach:
- Historical Price Action: Always start by looking at past significant swing highs (for resistance) and swing lows (for support). The more times a price level has been touched and reversed, the stronger its significance.
- Multiple Touches: Prioritize levels that have been tested and held multiple times. A level touched three or more times is generally considered more robust than one touched only once.
- Volume Confirmation: Look for increased trading volume around potential S&R levels. High volume at a reversal point strengthens the validity of that level.
- Timeframe Consistency: Identify S&R levels on higher timeframes (e.g., daily or weekly charts) first, as these tend to be more significant and durable. Then, refine your entry points on lower timeframes.
- Psychological Numbers: Round numbers (e.g., $100, $500, $1000) often act as natural psychological S&R levels due to human tendency to think in whole numbers.
Advanced Validation Techniques for Reliable S&R Zones
To further enhance the reliability of your identified levels, integrate these advanced validation methods:
- Confluence: A highly powerful concept where multiple technical indicators or analytical methods point to the same S&R level. For example, if a significant swing low, a Fibonacci retracement level, and a psychological round number all converge at the same price, that S&R zone is exceptionally strong.
- Fibonacci Retracements: Applying Fibonacci retracement levels to significant price swings often reveals potential S&R zones, especially the 38.2%, 50%, and 61.8% levels. These frequently align with historical turning points.
- Moving Averages: Longer-term Moving Averages (e.g., 50-period, 200-period Simple or Exponential Moving Averages) often act as dynamic support or resistance. When price interacts with these averages, observe the reaction for potential S&R confirmation.
- Candlestick Patterns: Look for powerful reversal candlestick patterns (e.g., Hammer, Shooting Star, Engulfing patterns, Doji) forming at your identified S&R levels. These patterns provide strong confirmation of buyer or seller exhaustion at that specific price.
- Support Turns Resistance (and vice-versa): A broken support level often becomes future resistance, and a broken resistance level often becomes future support. This concept is fundamental for understanding market dynamics and confirming the strength of a level.
Strategies for Precise Trade Entries Using S&R in 2026
The Bounce Play: Entry at Support or Resistance Retest
This is a classic and highly effective strategy. The idea is to enter a trade when the price “bounces” off a strong S&R level.
- For a Long Entry (Buy): Wait for the price to decline to a validated support level. Look for signs of reversal, such as bullish candlestick patterns (e.g., Hammer, Bullish Engulfing) or increasing buying volume, then enter the trade.
- For a Short Entry (Sell): Wait for the price to rise to a validated resistance level. Look for signs of reversal, such as bearish candlestick patterns (e.g., Shooting Star, Bearish Engulfing) or increasing selling volume, then enter the trade.
Verification Step: Always confirm the bounce with at least one candle closing within the desired direction from the S&R level.
The Breakout Strategy: Capitalizing on S&R Breaches
When price breaks convincingly above a resistance level or below a support level, it often signals the start of a new trend or a significant move. However, breakouts can be tricky due to false signals.
- Genuine Breakouts: Look for strong momentum, large volume accompanying the breakout candle, and the price closing significantly beyond the S&R level.
- Retest Confirmation: The most reliable breakout entry often occurs after a retest. The price breaks the S&R, then pulls back to test the now-flipped S&R level (broken resistance becomes new support; broken support becomes new resistance). An entry is confirmed when the price bounces off this retested level, exhibiting signs of continuation in the breakout direction. This reduces the risk of false breakouts significantly.
Integrating Volume and Price Action for Higher Probability Trades
Never rely solely on S&R lines. Always combine them with other forms of analysis:
- Volume Analysis: A breakout on high volume is much more reliable than one on low volume. Similarly, a bounce from support with increasing volume indicates strong buying interest.
- Price Action: Study candlestick patterns at S&R levels. Dojis, Hammers, Engulfing patterns, and Pin Bars provide critical clues about market sentiment and potential reversals. Look for smaller body candles and longer wicks at S&R levels as price action consolidates before making a move.
- Momentum Indicators: Use indicators like RSI or Stochastic to gauge overbought/oversold conditions as price approaches S&R. Divergences between price and indicator at S&R levels can signal impending reversals.
Risk Management and Position Sizing: Protecting Your Capital
No strategy, however precise, is foolproof. Effective risk management is non-negotiable for sustainable trading in 2026.
Setting Stop-Loss Orders Below Support and Above Resistance
This is where S&R levels provide immense value. Always place your stop-loss orders logically:
- For Long Trades: Place your stop-loss just below the support level you are trading off. This ensures that if the support fails, your loss is limited.
- For Short Trades: Place your stop-loss just above the resistance level you are trading off. This protects you if the resistance is breached.
Crucial Rule: Never risk more than 1-2% of your total trading capital on any single trade. Your stop-loss placement, combined with your desired profit target, will dictate your position size.
Realistic Target Setting and Profit Taking
Just as S&R helps with entries and stop losses, it also guides profit targets:
- Adjacent S&R: Often, the next significant support or resistance level is a natural target for taking profits. For a long trade initiated at support, the next resistance level is a logical take-profit point.
- Risk-Reward Ratio: Always ensure your potential profit (target) is significantly greater than your potential loss (stop-loss). A minimum 1:2 or 1:3 risk-reward ratio is highly recommended. This means for every $1 risked, you aim to make $2 or $3.
| Strategy | Entry Signal | Stop-Loss Placement | Target Area | Risk Profile |
|---|---|---|---|---|
| The Bounce Play (Long) | Price retests confirmed support level, shows bullish reversal (e.g., Hammer, Bullish Engulfing, volume spike). | Just below the confirmed support level. | Next significant resistance level. | Moderate (higher if S&R is weak). |
| The Bounce Play (Short) | Price retests confirmed resistance level, shows bearish reversal (e.g., Shooting Star, Bearish Engulfing, volume spike). | Just above the confirmed resistance level. | Next significant support level. | Moderate (higher if S&R is weak). |
| Breakout with Retest (Long) | Price breaks above resistance, then pulls back to retest it as new support, followed by bullish price action. | Just below the retested support level. | Next significant resistance level beyond the initial breakout. | Lower (due to retest confirmation). |
| Breakout with Retest (Short) | Price breaks below support, then pulls back to retest it as new resistance, followed by bearish price action. | Just above the retested resistance level. | Next significant support level beyond the initial breakout. | Lower (due to retest confirmation). |
Common Pitfalls and How to Avoid Them in 2026 Trading
Even seasoned traders can fall prey to common errors. Be aware of these to maintain your edge:
Over-reliance on Single Indicators
While S&R is powerful, it’s not a standalone magic bullet. Using it in isolation can lead to false signals. Always confirm your S&R analysis with other tools like volume, price action, trend lines, and other indicators to build a more robust trade hypothesis. This concept of confluence is your strongest ally.
Ignoring Market Context and Broader Trends
A strong support level in a clear downtrend is more likely to be broken than one in an uptrend or range-bound market. Always assess the overall market trend and larger economic narrative. Trading against the prevailing trend at an S&R level is generally higher risk. Use higher timeframe charts to identify the larger market trend before drilling down to find entries on lower timeframes.
Risk Disclosure: Trading financial markets carries substantial risk and is not suitable for all investors. Past performance is not indicative of future results. Always educate yourself thoroughly, practice with a demo account, and consult a financial advisor if needed. Never trade with money you cannot afford to lose.
Conclusion
In the evolving financial landscape of 2026, mastering Support and Resistance levels remains a cornerstone of intelligent, precise trading. By systematically identifying, validating, and strategically leveraging these critical price zones, you can significantly enhance your trade entry precision, improve your risk management, and ultimately boost your personal finance potential.
Remember, trading is a skill honed through continuous learning and disciplined practice. Integrate these guidelines into your trading plan, rigorously test them, and observe the market’s reactions. The power to make calculated, high-probability trades lies in your hands. Are you ready to elevate your trading game?
Frequently Asked Questions (FAQ)
How often should I redraw my Support and Resistance levels?
Support and Resistance levels are dynamic. While major, long-term levels (from daily or weekly charts) can remain relevant for extended periods, shorter-term levels (from hourly or 4-hour charts) may need to be redrawn or adjusted as price action evolves. It’s good practice to review and update your S&R levels at the start of each trading session or whenever there’s a significant shift in price.
Can Support and Resistance be used in all markets?
Absolutely. The principles of Support and Resistance are universal and apply to virtually all financial markets, including stocks, forex, commodities, cryptocurrencies, and indices. They are based on fundamental market psychology and supply/demand dynamics, which transcend specific asset classes.
What’s the difference between a weak and strong S&R level?
A strong Support or Resistance level is characterized by multiple price touches and rejections, significant volume at those levels, the presence of confluence with other indicators (e.g., Fibonacci, moving averages), and sometimes its origin on higher timeframes. A weak S&R level might have only one or two touches, lack volume confirmation, or be quickly breached, suggesting less market conviction around that price.
Should I only trade using Support and Resistance?
While S&R is a powerful tool for precise trade entries and exits, it’s generally best used in conjunction with other technical analysis tools and strategies. Combining S&R with trend analysis, candlestick patterns, volume indicators, and even fundamental analysis provides a more robust and higher-probability trading setup, minimizing false signals and improving overall strategy effectiveness.
Written by SamacharDesi Editorial Team
Official editorial intelligence team. We monitor, cross-verify, and publish high-utility reviews, guides, job alerts, and scheme parameters under strict factual verification guidelines.