Hey guys, SamacharDesi Editorial Team here, your trusted source for systematic market guidelines and data-driven insights. In the rapidly evolving financial landscape of 2026, making informed trading decisions is more critical than ever. Many aspiring traders believe that rigorously testing a strategy requires complex coding skills or expensive software. We’re here to debunk that myth!
- Understanding Backtesting: Your Blueprint for Trading Success in 2026
- Why Backtest Without Coding?
- Prerequisites for Effective Manual Backtesting
- Your Step-by-Step Guide to Backtesting Your Trading Strategy Without Coding
- Step 1: Define Your Trading Strategy with Precision
- Step 2: Choose Your Historical Data Source and Range
- Step 3: Set Up Your Spreadsheet for Tracking
- Step 4: Manually Execute Trades Based on Historical Data
- Step 5: Calculate Key Performance Metrics
- Step 6: Analyze and Refine Your Strategy
- Essential Backtesting Parameters and Metrics for 2026
- Risk Disclosures and Practical Considerations for 2026
- Conclusion: Empower Your Financial Independence in 2026
Today, we’re empowering you with a comprehensive, step-by-step guide to backtesting your trading strategy without coding. This isn’t just theory; these are verified calculations and actionable steps designed for your personal finance decisions in 2026, ensuring you gain a significant edge without writing a single line of code. Let’s dive in!
Understanding Backtesting: Your Blueprint for Trading Success in 2026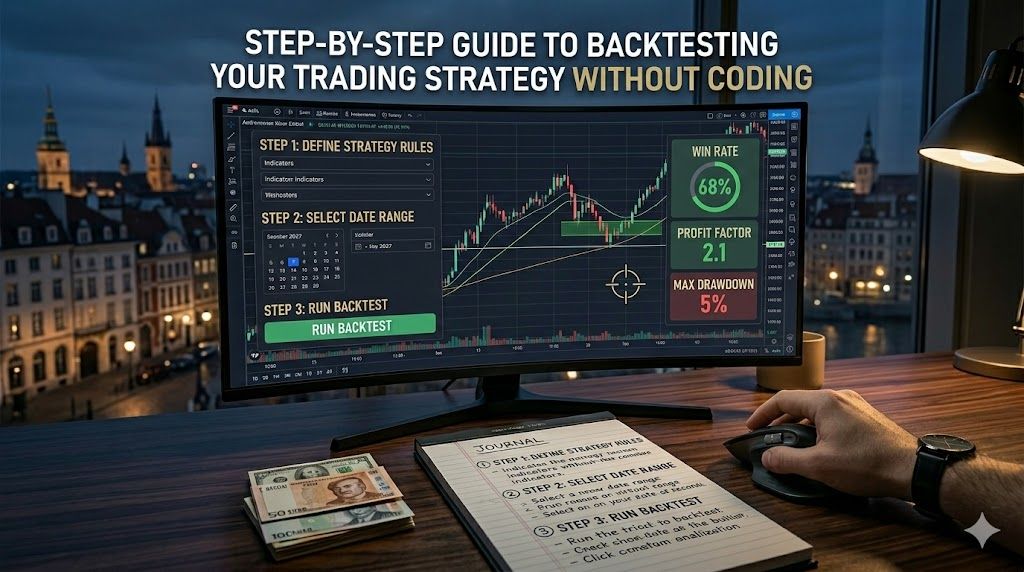
Backtesting is the process of testing a trading strategy using historical data to determine its viability before risking real capital. It’s akin to a scientist running experiments in a lab before releasing a product. For traders, it’s an indispensable tool for understanding a strategy’s strengths, weaknesses, and potential profitability under various market conditions.
In 2026, where market volatility and algorithmic trading are prevalent, relying on gut feelings is a recipe for disaster. Manual backtesting, while requiring diligence, offers invaluable insights into expected returns, risk exposure, and overall strategy robustness, paving the way for more confident and data-driven decisions.
Why Backtest Without Coding?
While automated backtesting platforms are powerful, they often come with a steep learning curve or subscription costs. For many individual investors and those just starting their trading journey, a no-code backtesting approach offers several distinct advantages:
- Accessibility: No programming knowledge or specialized software required. All you need is a spreadsheet and historical data.
- Deeper Understanding: Manually walking through each trade forces you to intimately understand your strategy’s rules, entry/exit points, and risk parameters.
- Cost-Effective: Leverage free historical data and readily available spreadsheet software.
- Flexibility: Easily adapt and tweak rules on the fly as you analyze performance.
Prerequisites for Effective Manual Backtesting
Before you begin, ensure you have these components ready:
- A Clearly Defined Trading Strategy: This is paramount. Your strategy must have explicit, objective rules for entry, exit (both profit targets and stop-losses), position sizing, and risk management. No “ifs” or “buts.”
- Reliable Historical Data: Depending on your asset class (stocks, forex, crypto, commodities), you’ll need access to past price data (e.g., daily OHLC – Open, High, Low, Close, or intraday data). Many brokers, financial websites (e.g., Yahoo Finance, Google Finance for historical stock data), or data providers offer this for free or at a low cost.
- A Spreadsheet Program: Microsoft Excel, Google Sheets, or LibreOffice Calc are perfect tools for tracking trades and performing calculations.
- Patience and Discipline: Backtesting without coding is a meticulous process that requires focus and adherence to your strategy’s rules without hindsight bias.
Your Step-by-Step Guide to Backtesting Your Trading Strategy Without Coding
Let’s get practical. Follow these verified steps to rigorously test your trading ideas for superior trading performance in 2026.
Step 1: Define Your Trading Strategy with Precision
This is the foundation. Every single rule must be quantifiable. Ask yourself:
- What specific conditions trigger a buy entry? (e.g., “Price crosses above 20-period Simple Moving Average (SMA) AND RSI is above 50”).
- What specific conditions trigger a sell/short entry?
- Where is your initial stop-loss placed? (e.g., “5% below entry price,” “below the previous swing low”).
- Where is your profit target? (e.g., “10% above entry price,” “at the next resistance level,” “trailing stop”).
- What is your position sizing rule? (e.g., “Risk no more than 1% of total capital per trade”).
- Are there any time-based exits or other management rules?
Keywords: entry and exit rules, risk management, position sizing
Step 2: Choose Your Historical Data Source and Range
Select a data range that includes various market conditions (bull markets, bear markets, sideways markets) to truly test your strategy’s robustness. For stocks, 3-5 years of daily data is a good starting point. For faster-moving markets like forex or crypto, even 6-12 months of 4-hour or 1-hour data might suffice initially.
- Download the historical data for the asset(s) you intend to trade into your spreadsheet. Ensure it includes at least Open, High, Low, Close, and Volume.
- Organize it chronologically, typically with the oldest data at the top.
Keywords: historical data, data range, market conditions
Step 3: Set Up Your Spreadsheet for Tracking
Create a dedicated sheet in Excel or Google Sheets. Essential columns will include:
- Date
- Asset
- Entry Price
- Entry Date/Time
- Stop Loss Price
- Take Profit Price
- Exit Price
- Exit Date/Time
- Position Size (e.g., number of shares/units)
- Gross P&L (Profit & Loss)
- Commissions/Fees (e.g., estimated slippage, broker fees)
- Net P&L
- Cumulative P&L
- Account Balance (initial capital – cumulative P&L)
- Trade Duration
Initialize your starting capital (e.g., $10,000).
Step 4: Manually Execute Trades Based on Historical Data
This is the core of manual backtesting. Go through your historical data row by row (or candle by candle on a chart) and apply your strategy’s rules as if you were trading in real-time. Crucially, do NOT look ahead at future data. You are simulating the past with the knowledge you would have had then.
- For each day/period, check if your entry conditions are met. If yes, record the trade details (entry price, date, stop loss, profit target).
- Then, for subsequent periods, track the trade. Did it hit your stop loss? Did it hit your profit target? Or did a time-based exit rule trigger?
- Record the exit details and calculate the gross P&L for that trade.
- Subtract estimated commissions and fees to get the net P&L.
- Update your cumulative P&L and account balance.
Risk Disclosure: Always factor in realistic transaction costs (commissions, slippage) into your calculations. Ignoring these can drastically inflate perceived profitability and lead to misleading results in live trading.
Step 5: Calculate Key Performance Metrics
Once you’ve backtested a sufficient number of trades (ideally 50-100+), it’s time to analyze the results. Your spreadsheet can automatically calculate these once you’ve input the trade data:
- Total Net Profit/Loss: Sum of all net P&L.
- Gross Profit/Loss: Sum of all gross P&L.
- Number of Trades: Total trades taken.
- Win Rate: (Number of winning trades / Total trades) * 100%.
- Loss Rate: (Number of losing trades / Total trades) * 100%.
- Average Win: Total profit from winning trades / Number of winning trades.
- Average Loss: Total loss from losing trades / Number of losing trades.
- Risk-Reward Ratio: Average Win / Average Loss.
- Maximum Drawdown: The largest percentage drop from a peak in your equity curve to a subsequent trough. This is a critical risk management indicator.
- Profit Factor: (Total Gross Profit / Total Gross Loss). A value > 1 indicates profitability.
- Sharpe Ratio (Approximation): While complex, a simpler version can be Net Profit / Max Drawdown (as a rough risk-adjusted return indicator).
Keywords: performance metrics, drawdown, profit factor, risk-adjusted returns, trading performance
Step 6: Analyze and Refine Your Strategy
This is where the real learning happens. Review your results:
- Is the strategy profitable over the chosen data range?
- Is the drawdown acceptable given your risk tolerance?
- Are there specific market conditions where the strategy performs poorly?
- Can you identify patterns in losing trades? Were the stop losses hit frequently, or were profit targets too ambitious?
- Experiment with small adjustments to your rules (e.g., slightly different moving average periods, tighter stop losses) and re-backtest that section of data.
This iterative process of analysis and refinement is crucial for optimizing your strategy and building confidence before moving to paper trading or live trading.
Essential Backtesting Parameters and Metrics for 2026
To summarize, here’s a table outlining critical parameters you must consider for robust backtesting your trading strategy without coding, especially for navigating the 2026 market landscape.
| Parameter/Metric | Description | Importance for Personal Finance Decisions in 2026 |
|---|---|---|
| Data Range & Quality | Length and reliability of historical data used. Ensure comprehensive market cycle coverage. | Mitigates curve-fitting; ensures strategy resilience across diverse 2026 market scenarios. |
| Transaction Costs | Commissions, slippage, taxes, and fees per trade. | Absolutely crucial for realistic net profit calculations, preventing overestimation of returns. |
| Position Sizing Model | Method for determining trade size (e.g., fixed units, fixed risk percentage). | Directly impacts risk management and account longevity; prevents catastrophic losses. |
| Maximum Drawdown | Largest percentage drop from an equity peak to a trough. | Key indicator of capital preservation and psychological tolerance during downturns. |
| Profit Factor | Gross Profits / Gross Losses. (Must be > 1 for profitability). | A quick, vital check of the strategy’s efficiency in generating more profit than loss. |
| Risk-Reward Ratio | Average profit per trade / Average loss per trade. | Ensures that winning trades sufficiently cover losing trades, even with a lower win rate. |
| Strategy Robustness | Performance across different assets and market conditions. | Confirms the strategy isn’t just lucky on one asset or in a specific market phase. |
Risk Disclosures and Practical Considerations for 2026
While backtesting your trading strategy without coding is incredibly valuable, it’s essential to understand its limitations and risks:
- Past Performance Does Not Guarantee Future Results: The market environment in 2026 may differ significantly from historical data. Economic shifts, regulatory changes, or unforeseen global events can impact strategy effectiveness.
- Slippage & Spreads: Manual backtesting often struggles to perfectly account for real-world slippage (the difference between expected and actual execution price) and widening spreads, especially in volatile conditions. Always factor in a conservative estimate.
- Emotional Bias: The biggest challenge in manual backtesting is avoiding hindsight bias. Stick rigidly to your rules; don’t “force” trades that weren’t there or skip ones that were.
- Data Accuracy: Ensure your historical data is accurate and free from errors. Bad data leads to bad results.
Always consider paper trading (simulated trading with real-time data) as the next crucial step after successful backtesting. This bridges the gap between historical simulation and live market conditions, allowing you to test your strategy and your emotional discipline in a risk-free environment.
Conclusion: Empower Your Financial Independence in 2026
There you have it! A comprehensive, step-by-step guide to backtesting your trading strategy without coding, meticulously designed by the SamacharDesi Editorial Team for your personal finance decisions in 2026. This process, though requiring dedication, will fundamentally transform your approach to trading, moving you from speculative gambling to calculated, data-driven decisions.
Embrace this powerful analytical tool. Test, refine, and build confidence in your strategies. Your journey towards more consistent trading success and greater financial independence starts with diligent backtesting. Start today, and be prepared to conquer the market landscape of 2026!
Got questions about backtesting your trading strategy? Let’s clarify!
Q1: How much historical data should I use for backtesting?
A: The ideal amount of data depends on your trading frequency and the asset. For daily charts, 3-5 years of data is a good starting point to cover various market cycles (bull, bear, sideways). For intraday strategies, 6-12 months of high-quality data might be sufficient. The key is to have enough data to generate a statistically significant number of trades (ideally 50-100+) and cover different market regimes.
Q2: What if my strategy involves multiple assets? How do I backtest that manually?
A: Backtesting a multi-asset strategy manually is more complex but still feasible. You’d typically need to consolidate the historical data for all assets into one workbook, perhaps on separate sheets. When a signal appears for one asset, you’d record that trade. The challenge lies in ensuring you don’t overcomplicate the tracking, especially if signals can occur simultaneously. Consider focusing on a primary asset or a small basket of assets initially, or use a separate spreadsheet for each asset and combine the performance metrics later.
Q3: Is manual backtesting as accurate as automated backtesting?
A: While automated backtesting offers speed and precision in calculations, manual backtesting can be just as accurate in terms of simulating trade entries and exits, provided you are disciplined and avoid hindsight bias. Manual backtesting offers a deeper understanding of the strategy’s mechanics and edge cases. However, it’s more prone to human error in data entry or calculation. Automated systems excel at processing vast amounts of data quickly and consistently applying rules, but their accuracy depends entirely on the correct coding of those rules.
Q4: How often should I re-backtest my strategy?
A: It’s good practice to periodically re-evaluate your strategy, especially if market conditions change significantly or if your live trading results start to deviate from your backtested expectations. A quarterly or semi-annual review, or whenever you consider making substantial adjustments to your strategy, is recommended. Always backtest any new variations or tweaks before implementing them live.
Q5: What is the most common mistake traders make during manual backtesting?
A: The most common mistake is hindsight bias. Traders, knowing how the market moved, subconsciously adjust their entry or exit points to make the trade look better, or they ignore legitimate signals that led to losses. It’s crucial to strictly follow your predefined rules without any forward-looking information. Another common mistake is not accounting for realistic transaction costs (slippage, commissions), which can make a seemingly profitable strategy unprofitable in live trading.
Written by SamacharDesi Editorial Team
Official editorial intelligence team. We monitor, cross-verify, and publish high-utility reviews, guides, job alerts, and scheme parameters under strict factual verification guidelines.