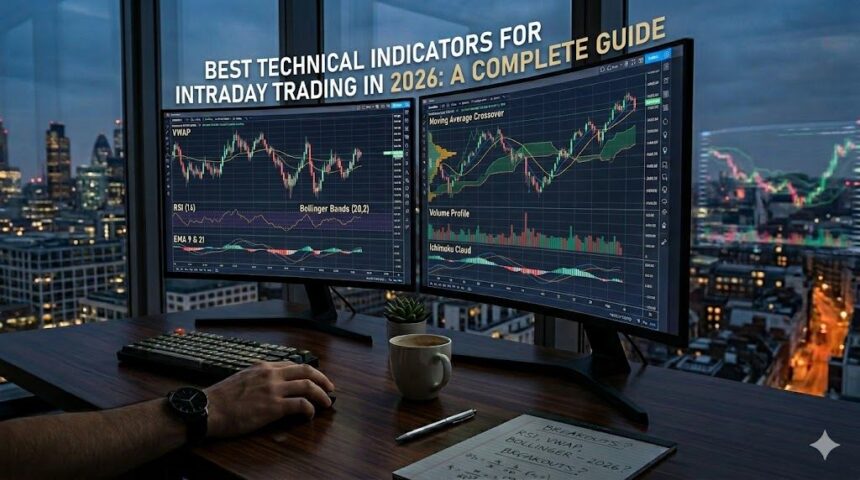
Hey guys, the SamacharDesi Editorial Team here, your trusted source for cutting-edge market insights and strategic financial guidance. As we rapidly approach 2026, the dynamics of the financial markets are evolving faster than ever. For those engaged in the thrilling, high-stakes world of intraday trading, mastering the art of real-time decision-making is paramount. Today, we’re diving deep into the ‘Best Technical Indicators for Intraday Trading in 2026: A Complete Guide‘ to equip you with the verified tools and systematic guidelines needed to navigate tomorrow’s markets with confidence.
- Understanding the Power of Technical Indicators in Intraday Trading
- Top Technical Indicators for Intraday Trading in 2026
- 1. Moving Averages (MA)
- 2. Relative Strength Index (RSI)
- 3. Moving Average Convergence Divergence (MACD)
- 4. Bollinger Bands (BB)
- Combining Indicators for Stronger Intraday Signals
- Essential Risk Management for Intraday Trading in 2026
- Key Technical Indicator Specifications & Usage Comparison for 2026
- Optimizing Your Trading for 2026: Beyond Indicators
- Conclusion: Your Edge in 2026’s Intraday Markets
- Frequently Asked Questions (FAQ)
The year 2026 promises enhanced technological integration, potentially higher market volatility due to geopolitical shifts and rapid economic adjustments, and an ever-increasing need for precise, data-driven analysis. Outdated strategies simply won’t cut it. This comprehensive guide will break down the most effective technical indicators, explain their calculations, and provide practical applications to help you make informed personal finance decisions within the ultra-short-term trading horizon.
Understanding the Power of Technical Indicators in Intraday Trading
In intraday trading, every second counts. Traders aim to capitalize on small price movements within a single trading day, closing all positions before the market closes. This demands rapid identification of trends, momentum, and potential reversals. Technical indicators are mathematical calculations based on historical price, volume, or open interest data, displayed graphically on a price chart. They help predict future price movements and provide objective signals, reducing emotional biases – a critical factor for success in 2026’s fast-paced environment.
Why 2026 Demands Advanced Indicator Proficiency
With the rise of sophisticated algorithms, AI-driven trading systems, and ultra-low latency data feeds, retail intraday traders in 2026 need to be sharper than ever. The indicators we discuss are not just theoretical; they are battle-tested tools that, when used correctly, can provide a significant edge. Our focus is on indicators that offer clarity and actionable signals within short timeframes, adaptable to varying market conditions from high-liquidity stocks to volatile cryptocurrencies.
Top Technical Indicators for Intraday Trading in 2026
Here’s a breakdown of the most reliable technical indicators you should integrate into your intraday trading strategy for 2026.
1. Moving Averages (MA)
Moving Averages are fundamental to identifying trends and are indispensable for intraday analysis. They smooth out price data over a specific period, making it easier to spot the direction of the trend. For intraday trading, shorter period MAs (e.g., 9-period, 20-period, 50-period) are most relevant.
- Explanation: Simple Moving Average (SMA) calculates the average price over ‘N’ periods. Exponential Moving Average (EMA) gives more weight to recent prices, making it more responsive.
- Why crucial for 2026: EMAs, in particular, react quickly to price changes, essential for capturing short-term trends and reversals in volatile 2026 markets.
- Verified Calculation/Steps:
- SMA: Sum of closing prices over ‘N’ periods / ‘N’.
- EMA: (Closing Price – Previous Day’s EMA) * Multiplier + Previous Day’s EMA. (Multiplier = 2 / (N + 1)).
- Application: Look for price crossing above a short-term EMA for a bullish signal, or below for a bearish signal. Crossovers of different period MAs (e.g., 9 EMA crossing 20 EMA) also generate strong trading signals.
2. Relative Strength Index (RSI)
The Relative Strength Index (RSI) is a momentum oscillator that measures the speed and change of price movements. It’s excellent for identifying overbought or oversold conditions, helping you anticipate potential reversals.
- Explanation: RSI oscillates between 0 and 100. Traditionally, a reading above 70 indicates an overbought condition, while a reading below 30 suggests an oversold condition.
- Why crucial for 2026: In highly volatile intraday markets, price can move rapidly, creating frequent overbought/oversold situations. RSI helps pinpoint these exhaustion points for potential counter-trend trades or confirmation of trend reversals.
- Verified Calculation/Steps:
- RSI = 100 – [100 / (1 + RS)] where RS = Average Gain / Average Loss over ‘N’ periods (typically 14 periods).
- Application:
- Buy Signal: RSI moves from below 30 (oversold) back above 30.
- Sell Signal: RSI moves from above 70 (overbought) back below 70.
- Divergence: Price makes a new high, but RSI makes a lower high (bearish divergence); conversely for bullish divergence.
3. Moving Average Convergence Divergence (MACD)
The MACD is a trend-following momentum indicator that shows the relationship between two Moving Averages of a security’s price. It provides both trend direction and momentum signals.
- Explanation: MACD consists of three components: the MACD line (difference between two EMAs), the Signal line (EMA of the MACD line), and the Histogram (difference between MACD line and Signal line).
- Why crucial for 2026: Its dual ability to identify trend strength and direction, alongside potential reversals via crossovers and divergences, makes it a powerful tool for short-term traders.
- Verified Calculation/Steps:
- MACD Line: 12-period EMA – 26-period EMA.
- Signal Line: 9-period EMA of the MACD Line.
- Histogram: MACD Line – Signal Line.
- Application:
- Buy Signal: MACD line crosses above the Signal line (bullish crossover) and the histogram turns positive.
- Sell Signal: MACD line crosses below the Signal line (bearish crossover) and the histogram turns negative.
- Divergence: Similar to RSI, divergence between price and MACD can signal impending reversals.
4. Bollinger Bands (BB)
Bollinger Bands are volatility bands placed above and below a Moving Average. They adapt to market conditions, widening during periods of high volatility and contracting during low volatility periods.
- Explanation: Consist of a middle band (typically a 20-period SMA) and two outer bands (usually two standard deviations away from the SMA).
- Why crucial for 2026: Given anticipated market volatility, Bollinger Bands help visualize whether prices are high or low on a relative basis, and signal potential breakouts or reversals.
- Verified Calculation/Steps:
- Middle Band: 20-period Simple Moving Average (SMA).
- Upper Band: Middle Band + (Standard Deviation of price x 2).
- Lower Band: Middle Band – (Standard Deviation of price x 2).
- Application:
- Squeeze: When bands narrow significantly, it often precedes a period of increased volatility and a potential breakout.
- Breakouts: Price moving outside the bands can signal the start of a strong trend continuation.
- Reversals: Price touching or slightly exceeding a band and then quickly retreating can indicate a reversal, especially when combined with other indicators like RSI.

Combining Indicators for Stronger Intraday Signals
No single indicator is foolproof. The most effective intraday trading strategy in 2026 involves using a combination of indicators to confirm signals and reduce false positives. For instance:
- Use Moving Averages to identify the primary trend.
- Then, use RSI to pinpoint overbought/oversold levels within that trend for entry/exit points.
- Confirm momentum and potential crossovers with MACD.
- Finally, observe Bollinger Bands for volatility cues and potential breakouts or reversals.
Essential Risk Management for Intraday Trading in 2026
The allure of quick profits in intraday trading comes with significant risks. Effective risk management is non-negotiable, especially in 2026’s dynamic markets. We at SamacharDesi cannot stress this enough: protect your capital!
- Always use Stop-Loss Orders: This is your primary defense against catastrophic losses. Define your maximum acceptable loss per trade before entering.
- Position Sizing: Never risk more than 1-2% of your total trading capital on a single trade. Over-leveraging is a common downfall.
- Capital Preservation: Focus on small, consistent gains rather than chasing large, infrequent wins.
- Psychological Discipline: Stick to your trading plan. Avoid emotional decisions (fear of missing out, revenge trading).
- Continuous Learning: Markets evolve. Stay updated with new strategies, technologies, and economic reports.
Risk Disclosure: Intraday trading involves substantial risk and is not suitable for all investors. The high degree of leverage can work against you as well as for you. Before deciding to trade, you should carefully consider your investment objectives, level of experience, and risk appetite. You could lose some or all of your initial investment. Seek advice from an independent financial advisor if you have any doubts.
Key Technical Indicator Specifications & Usage Comparison for 2026
To help you compare and integrate these tools into your 2026 trading strategies, here’s a comparative overview:
| Indicator | Primary Function | Best For Intraday | Typical Settings (Intraday) | Key Signal |
|---|---|---|---|---|
| Moving Averages (EMA) | Trend Identification & Smoothing | Fast-moving trends, support/resistance | 9, 20, 50 periods | Price/MA crossovers, MA crossovers |
| Relative Strength Index (RSI) | Momentum & Overbought/Oversold levels | Reversal points, trend exhaustion | 14 periods (30/70 levels) | Crossing 30/70, Divergence |
| MACD | Trend Strength, Momentum & Reversals | Trend confirmation, early reversal signals | 12, 26, 9 periods | MACD/Signal line crossovers, Histogram changes |
| Bollinger Bands | Volatility & Relative Price Levels | Breakouts, mean reversion, volatility changes | 20 periods, 2 Standard Deviations | Band squeezes, price touching/exceeding bands |
Optimizing Your Trading for 2026: Beyond Indicators
While technical indicators are powerful, successful intraday trading in 2026 will also require:
- AI/ML Tools: Consider integrating AI-powered scanners and predictive analytics if your platform offers them. They can process vast amounts of real-time data analysis far quicker than humans.
- Understanding Market Microstructure: Be aware of high-frequency trading (HFT) and order book dynamics, which influence short-term price action.
- Staying Updated on News: Economic reports, corporate earnings, and geopolitical events can cause sudden shifts in market volatility, overriding technical signals.
- Backtesting & Forward Testing: Always test your chosen indicator combinations and strategies rigorously on historical and live (demo) data before deploying real capital.
Conclusion: Your Edge in 2026’s Intraday Markets
The journey to becoming a proficient intraday trader in 2026 is continuous. By mastering these best technical indicators – Moving Averages, RSI, MACD, and Bollinger Bands – and integrating them with robust risk management practices, you are building a strong foundation for consistent performance. Remember, successful intraday trading isn’t about magical indicators; it’s about discipline, continuous learning, and an unwavering commitment to your strategy. The SamacharDesi Editorial Team is dedicated to bringing you the most actionable insights to empower your financial decisions. Start practicing, stay vigilant, and let 2026 be your year of informed trading!
Frequently Asked Questions (FAQ)
What is the single best technical indicator for intraday trading in 2026?
There is no single “best” indicator. The most effective approach involves combining several indicators (e.g., EMA, RSI, MACD, Bollinger Bands) to confirm signals and enhance accuracy for intraday trading strategies.
How often should I adjust my indicator settings for intraday trading?
Indicator settings are often optimized for specific instruments or market conditions. While standard settings (e.g., 14 for RSI, 12/26/9 for MACD) are a good starting point, regular backtesting on the assets you trade can help you fine-tune them. However, avoid constant changes; consistency is key.
Can I rely solely on technical indicators for my 2026 intraday trading?
While technical indicators are powerful, it’s generally not advisable to rely on them exclusively. Integrating fundamental analysis (briefly understanding the news and economic context) and, critically, robust risk management, provides a more holistic and safer approach to intraday trading in 2026.
What timeframe should I use for intraday charts when applying these indicators?
For intraday trading, common timeframes range from 1-minute to 15-minute charts. Many traders use a multi-timeframe approach, perhaps viewing a 15-minute chart for overall trend and a 5-minute or 1-minute chart for precise entry and exit points. The choice depends on your strategy and the volatility of the asset.
Is intraday trading suitable for beginners in 2026?
Intraday trading is highly challenging and carries significant risk. It requires extensive knowledge, discipline, and substantial capital. While educational resources like this guide can help, beginners should start with simulated trading (paper trading) to gain experience without risking real capital before venturing into live intraday trading in 2026 markets.
Written by SamacharDesi Editorial Team
Official editorial intelligence team. We monitor, cross-verify, and publish high-utility reviews, guides, job alerts, and scheme parameters under strict factual verification guidelines.