Hey guys, SamacharDesi Editorial Team here, bringing you crucial insights for navigating the dynamic financial markets of 2026. As personal finance decisions become increasingly complex, especially with evolving market dynamics, understanding fundamental trading methodologies is paramount. Today, we’re dissecting a perennial debate among aspiring traders: Price Action Trading vs. Indicators. Which approach offers a clearer path for beginners stepping into the trading arena?
- Understanding Price Action Trading in 2026
- What is Price Action Trading?
- Core Principles and Techniques
- Advantages for Beginner Traders
- Disadvantages and Risks
- Exploring Technical Indicators for Trading Decisions
- What are Technical Indicators?
- Popular Indicators and Their Use
- Advantages for Beginner Traders
- Disadvantages and Risks
- Price Action vs. Indicators: A 2026 Comparative Analysis
- Fundamental Differences
- The Synergy of Both Approaches
- Key Considerations for Beginner Traders in the Current Market
- Structured Comparison: Price Action vs. Indicators
- Building Your Trading Foundation: Recommended Steps for Beginners (2026)
- Step 1: Education and Practice
- Step 2: Risk Management First
- Step 3: Start Simple
- Step 4: Develop a Trading Plan
- Risk Disclosure: Your Capital is at Stake
For those aiming to build a robust financial future, making informed choices about your trading strategy is as critical as your initial capital allocation. Join us as we break down these two powerful techniques, offering systematic market guidelines, verified steps, essential risk disclosures, and data comparisons to empower your personal finance journey in 2026.
Understanding Price Action Trading in 2026
What is Price Action Trading?
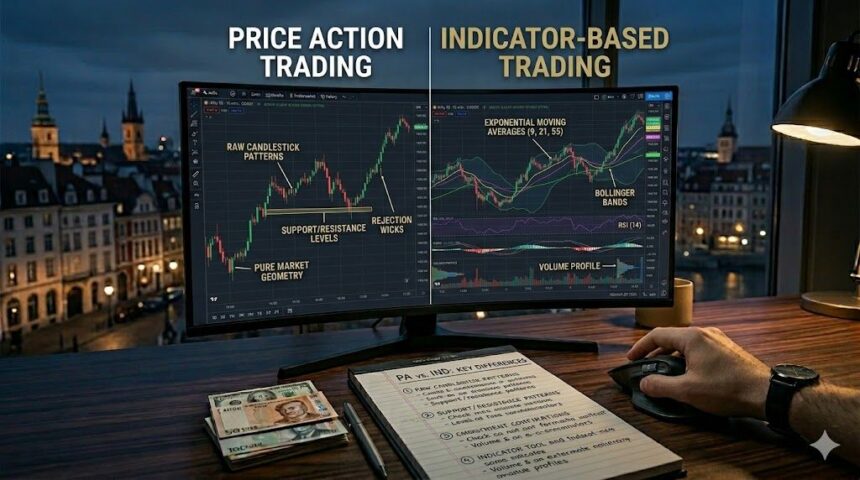
Price action trading is a methodology where traders make decisions based solely on the raw movement of a security’s price, as displayed on charts, without the use of lagging technical indicators. It’s about reading the “story” the market is telling through candlestick patterns, support and resistance levels, trend lines, and other visual formations. In 2026, with the sheer volume of information and often contradictory signals, the purity and directness of price action can be incredibly appealing for identifying true market sentiment.
Core Principles and Techniques
At its heart, price action relies on identifying repetitive human behavior reflected in market prices. Key techniques include:
- Candlestick Patterns: Recognizing formations like Dojis, Engulfing patterns, Hammers, and Shooting Stars that signal potential reversals or continuations.
- Support and Resistance: Identifying price levels where buying (support) or selling (resistance) pressure historically accumulates, often acting as barriers to price movement.
- Trend Lines and Channels: Drawing lines to identify the direction and strength of a trend, helping define entry and exit points.
- Chart Patterns: Spotting broader formations such as Head and Shoulders, Double Tops/Bottoms, Triangles, and Flags, which suggest larger market movements.
The beauty lies in its forward-looking nature; price action traders react to what the market is doing *now*, not what it has already done.
Advantages for Beginner Traders
- Simplicity and Clarity: Eliminates the clutter of multiple indicators, focusing on the most fundamental data point – price. This can reduce cognitive overload for beginners.
- No Lag: Price action provides real-time signals, as it’s directly analyzing current market behavior, making it responsive to rapid changes in 2026 markets.
- Foundation for Advanced Trading: Mastering price action builds a strong intuitive understanding of market dynamics, which is invaluable even if you later incorporate indicators.
- Applicable Across Markets: Principles apply universally to stocks, forex, commodities, and even cryptocurrencies, offering versatility for personal finance diversification.
Disadvantages and Risks
- Subjectivity: Interpreting price patterns can be subjective, leading to inconsistent analysis among different traders. What one sees as a breakout, another might see as a false signal.
- Requires Experience: While seemingly simple, consistently profitable price action trading demands significant screen time, practice, and the ability to read context. Beginners might struggle initially.
- Emotional Discipline: The lack of strict, objective rules (compared to indicator-based systems) means a higher reliance on self-discipline and emotional control.
- Risk of Overtrading: The constant stream of price data can lead to overtrading if not managed with a strict trading plan.
Exploring Technical Indicators for Trading Decisions
What are Technical Indicators?
Technical indicators are mathematical calculations based on a security’s historical price, volume, or open interest data. They are plotted on a chart and designed to forecast future price movements or provide insight into market conditions. Popularized in the digital trading age, these tools offer a quantitative lens through which to view market trends and momentum, essential for informed personal finance decisions in 2026.
Popular Indicators and Their Use
Hundreds of indicators exist, but some are particularly common:
- Moving Averages (MA): Smooth out price data to identify trends. A 50-period MA crossing above a 200-period MA (a “golden cross”) often signals a bullish trend.
- Relative Strength Index (RSI): A momentum oscillator that measures the speed and change of price movements. It ranges from 0 to 100, with readings above 70 indicating overbought conditions and below 30 indicating oversold conditions.
- Moving Average Convergence Divergence (MACD): A trend-following momentum indicator that shows the relationship between two moving averages of a security’s price. It consists of the MACD line, signal line, and histogram.
- Stochastic Oscillator: Compares a particular closing price of a security to a range of its prices over a certain period of time. Used to identify overbought and oversold conditions and potential reversals.
Each indicator attempts to quantify a specific aspect of market behavior, such as momentum, volatility, or trend strength.
Advantages for Beginner Traders
- Objectivity: Indicators provide clear, objective signals (e.g., “RSI crosses above 30”). This can reduce emotional decision-making for beginners.
- Quantifiable Rules: Easier to backtest and automate trading strategies based on precise indicator conditions.
- Simplified Analysis: Can help new traders quickly identify trends, overbought/oversold conditions, or potential entry/exit points without extensive chart pattern recognition skills.
- Confirmation Tool: Even for price action traders, indicators can serve as a confirmation tool to validate their analysis.
Disadvantages and Risks
- Lagging Nature: Indicators are derived from past price data, meaning they always provide signals after the price move has already begun. This “lag” can result in delayed entries or exits.
- Whipsaws and False Signals: In choppy or sideways markets, indicators can generate numerous false signals, leading to unprofitable trades.
- Over-Optimization: The temptation to tweak indicator settings to perfectly fit historical data can lead to strategies that fail in live market conditions.
- Information Overload: Using too many indicators can lead to conflicting signals, confusion, and “analysis paralysis” for beginners.
Price Action vs. Indicators: A 2026 Comparative Analysis
Fundamental Differences
The core distinction lies in their approach:
- Price Action: Focuses on the *cause* of market movement (supply and demand dynamics) as seen directly in the price chart. It’s about reading the market’s raw language.
- Indicators: Focuses on the *effect* of market movement, quantifying past price data to project future possibilities. It’s about interpreting a processed version of the market’s language.
For beginner traders in 2026, understanding this difference is key to choosing a path that aligns with their learning style and risk tolerance.
The Synergy of Both Approaches
While often presented as an either/or choice, many experienced traders leverage a hybrid approach. They might use price action as their primary decision-making tool, then confirm their biases with one or two non-lagging indicators (like volume or a simple moving average) to enhance conviction. This synergistic approach aims to combine the responsiveness of price action with the objectivity of indicators, fostering more robust trading strategies.
Key Considerations for Beginner Traders in the Current Market
In 2026, market volatility, influenced by geopolitical factors, technological shifts, and evolving economic policies, requires adaptability. Here’s what beginners should consider:
- Learning Curve: Price action has a steeper initial learning curve for pattern recognition and subjective interpretation. Indicators offer more straightforward rules, but require understanding their limitations and lag.
- Risk Management: Both methods demand rigorous risk management. Beginners must understand position sizing, stop-loss placement, and overall capital preservation regardless of their chosen analysis tool.
- Time Horizon: Shorter-term traders (scalpers, day traders) might lean towards price action’s real-time nature. Longer-term traders might find indicators more helpful for identifying broader trends.
- Personal Preference: Some individuals are more visual and intuitive (price action), while others prefer quantitative, rule-based systems (indicators).
Structured Comparison: Price Action vs. Indicators
Here’s a concise comparison to help beginner traders make an informed decision for their personal finance decisions in 2026:
| Feature | Price Action Trading | Technical Indicators |
|---|---|---|
| Core Focus | Raw price movement, chart patterns, support/resistance. | Mathematical calculations based on historical price/volume. |
| Learning Curve (Beginner) | Steeper initially due to subjectivity and experience needed for pattern recognition. | Generally easier to grasp basic rules; understanding nuances takes time. |
| Objectivity | Highly subjective; depends on trader’s interpretation. | More objective, with clear entry/exit signals based on mathematical rules. |
| Timeliness of Signals | Real-time, non-lagging. Direct reflection of current supply/demand. | Lagging; signals generated from past data, often delayed. |
| Adaptability | Highly adaptable across various market conditions and timeframes. | May require re-optimization for different markets or conditions. |
| Risk of False Signals | Can be high if patterns are misinterpreted or context is ignored. | High in choppy markets; susceptible to whipsaws. |
| Suitability for Beginners | Good for those seeking deep market understanding, willing to practice extensively. | Good for rule-based learners seeking clear, quantitative signals. |
| Recommended Starting Point | Start with basic support/resistance and trend lines. | Start with 1-2 simple indicators like Moving Averages or RSI. |
Building Your Trading Foundation: Recommended Steps for Beginners (2026)
Step 1: Education and Practice
Regardless of your chosen path, continuous education is non-negotiable. Immerse yourself in learning about chart patterns, candlestick formations, indicator mechanics, and market microstructure. Utilize demo accounts extensively. Practice identifying setups, executing trades, and managing risk without putting real capital at stake. This is a critical verified step for developing proficiency in 2026’s fast-paced markets.
Step 2: Risk Management First
This is arguably the most important systematic market guideline. Before even considering an entry, define your maximum tolerable loss per trade (e.g., 1-2% of your trading capital). Implement strict stop-loss orders. Never risk more than you can comfortably afford to lose. Capital preservation is paramount for long-term survival in trading.
Step 3: Start Simple
Do not try to master everything at once. If leaning towards price action, focus on simple concepts like identifying clear trends and strong support/resistance zones. If using indicators, pick one or two that you understand thoroughly, like a single moving average or the RSI. Overcomplication is a common pitfall for beginners.
Step 4: Develop a Trading Plan
A comprehensive trading plan is your roadmap. It should detail your chosen strategy, entry and exit criteria, risk management rules, position sizing, and psychological preparation. Stick to it rigorously. Review and refine it based on your performance in a demo account before risking real money.
Risk Disclosure: Your Capital is at Stake
Trading in financial markets, whether using price action trading or technical indicators, carries a high level of risk. You could lose some or all of your invested capital. These market guidelines are for educational purposes only and do not constitute financial advice. Always consult with a qualified financial advisor before making any personal finance decisions. Past performance is not indicative of future results.
In conclusion, for beginner traders looking to make informed personal finance decisions in 2026, there isn’t a universally “better” approach. Price action trading offers a fundamental understanding of market dynamics, fostering intuition and real-time responsiveness, but demands patience and extensive practice. Technical indicators provide objective, rule-based signals that can simplify analysis, but come with the inherent drawback of lag and potential false signals.
Our recommendation for beginners is to start with a foundational understanding of price action—learning to read raw charts, identify trends, and spot key support/resistance levels. Once you grasp these basics, you can then selectively introduce one or two well-understood technical indicators as supplementary confirmation tools, not as primary decision-makers. This balanced approach provides a solid framework for developing robust trading strategies and managing risk effectively in the complex markets of 2026. What’s your preferred approach, or are you considering a hybrid method? Share your thoughts with us!
Frequently Asked Questions (FAQ)
Q1: Can I solely rely on price action as a beginner?
A1: While possible, it requires significant dedication to screen time and practice to develop the necessary intuition and pattern recognition skills. It’s often recommended to start with basic price action concepts like support, resistance, and trend lines, and gradually build up your understanding.
Q2: How many indicators should a beginner use?
A2: For beginners, it’s best to start with one or two simple, widely understood indicators. Overloading your chart with too many indicators often leads to conflicting signals and analysis paralysis. A simple moving average or the Relative Strength Index (RSI) are good starting points.
Q3: Is price action trading better for short-term or long-term trading?
A3: Price action is highly versatile and can be applied across all timeframes. Its real-time nature makes it particularly effective for short-term trading (scalping, day trading), but understanding price structures is also crucial for identifying significant long-term trends and reversals.
Q4: Do professional traders use only one method (price action or indicators)?
A4: Many professional traders employ a hybrid approach. They often use price action as their primary decision-making framework and then use a select few indicators to confirm their analysis, identify divergences, or gauge momentum. Purely relying on one method is less common among seasoned pros.
Q5: What is the most important aspect for a beginner, regardless of chosen method?
A5: Without a doubt, rigorous risk management and emotional discipline are the most important aspects. Understanding position sizing, setting stop-losses, and sticking to a well-defined trading plan will determine long-term success more than any specific analytical tool.
⚡ Share This Update:
Written by SamacharDesi Editorial Team
Official editorial intelligence team. We monitor, cross-verify, and publish high-utility reviews, guides, job alerts, and scheme parameters under strict factual verification guidelines.